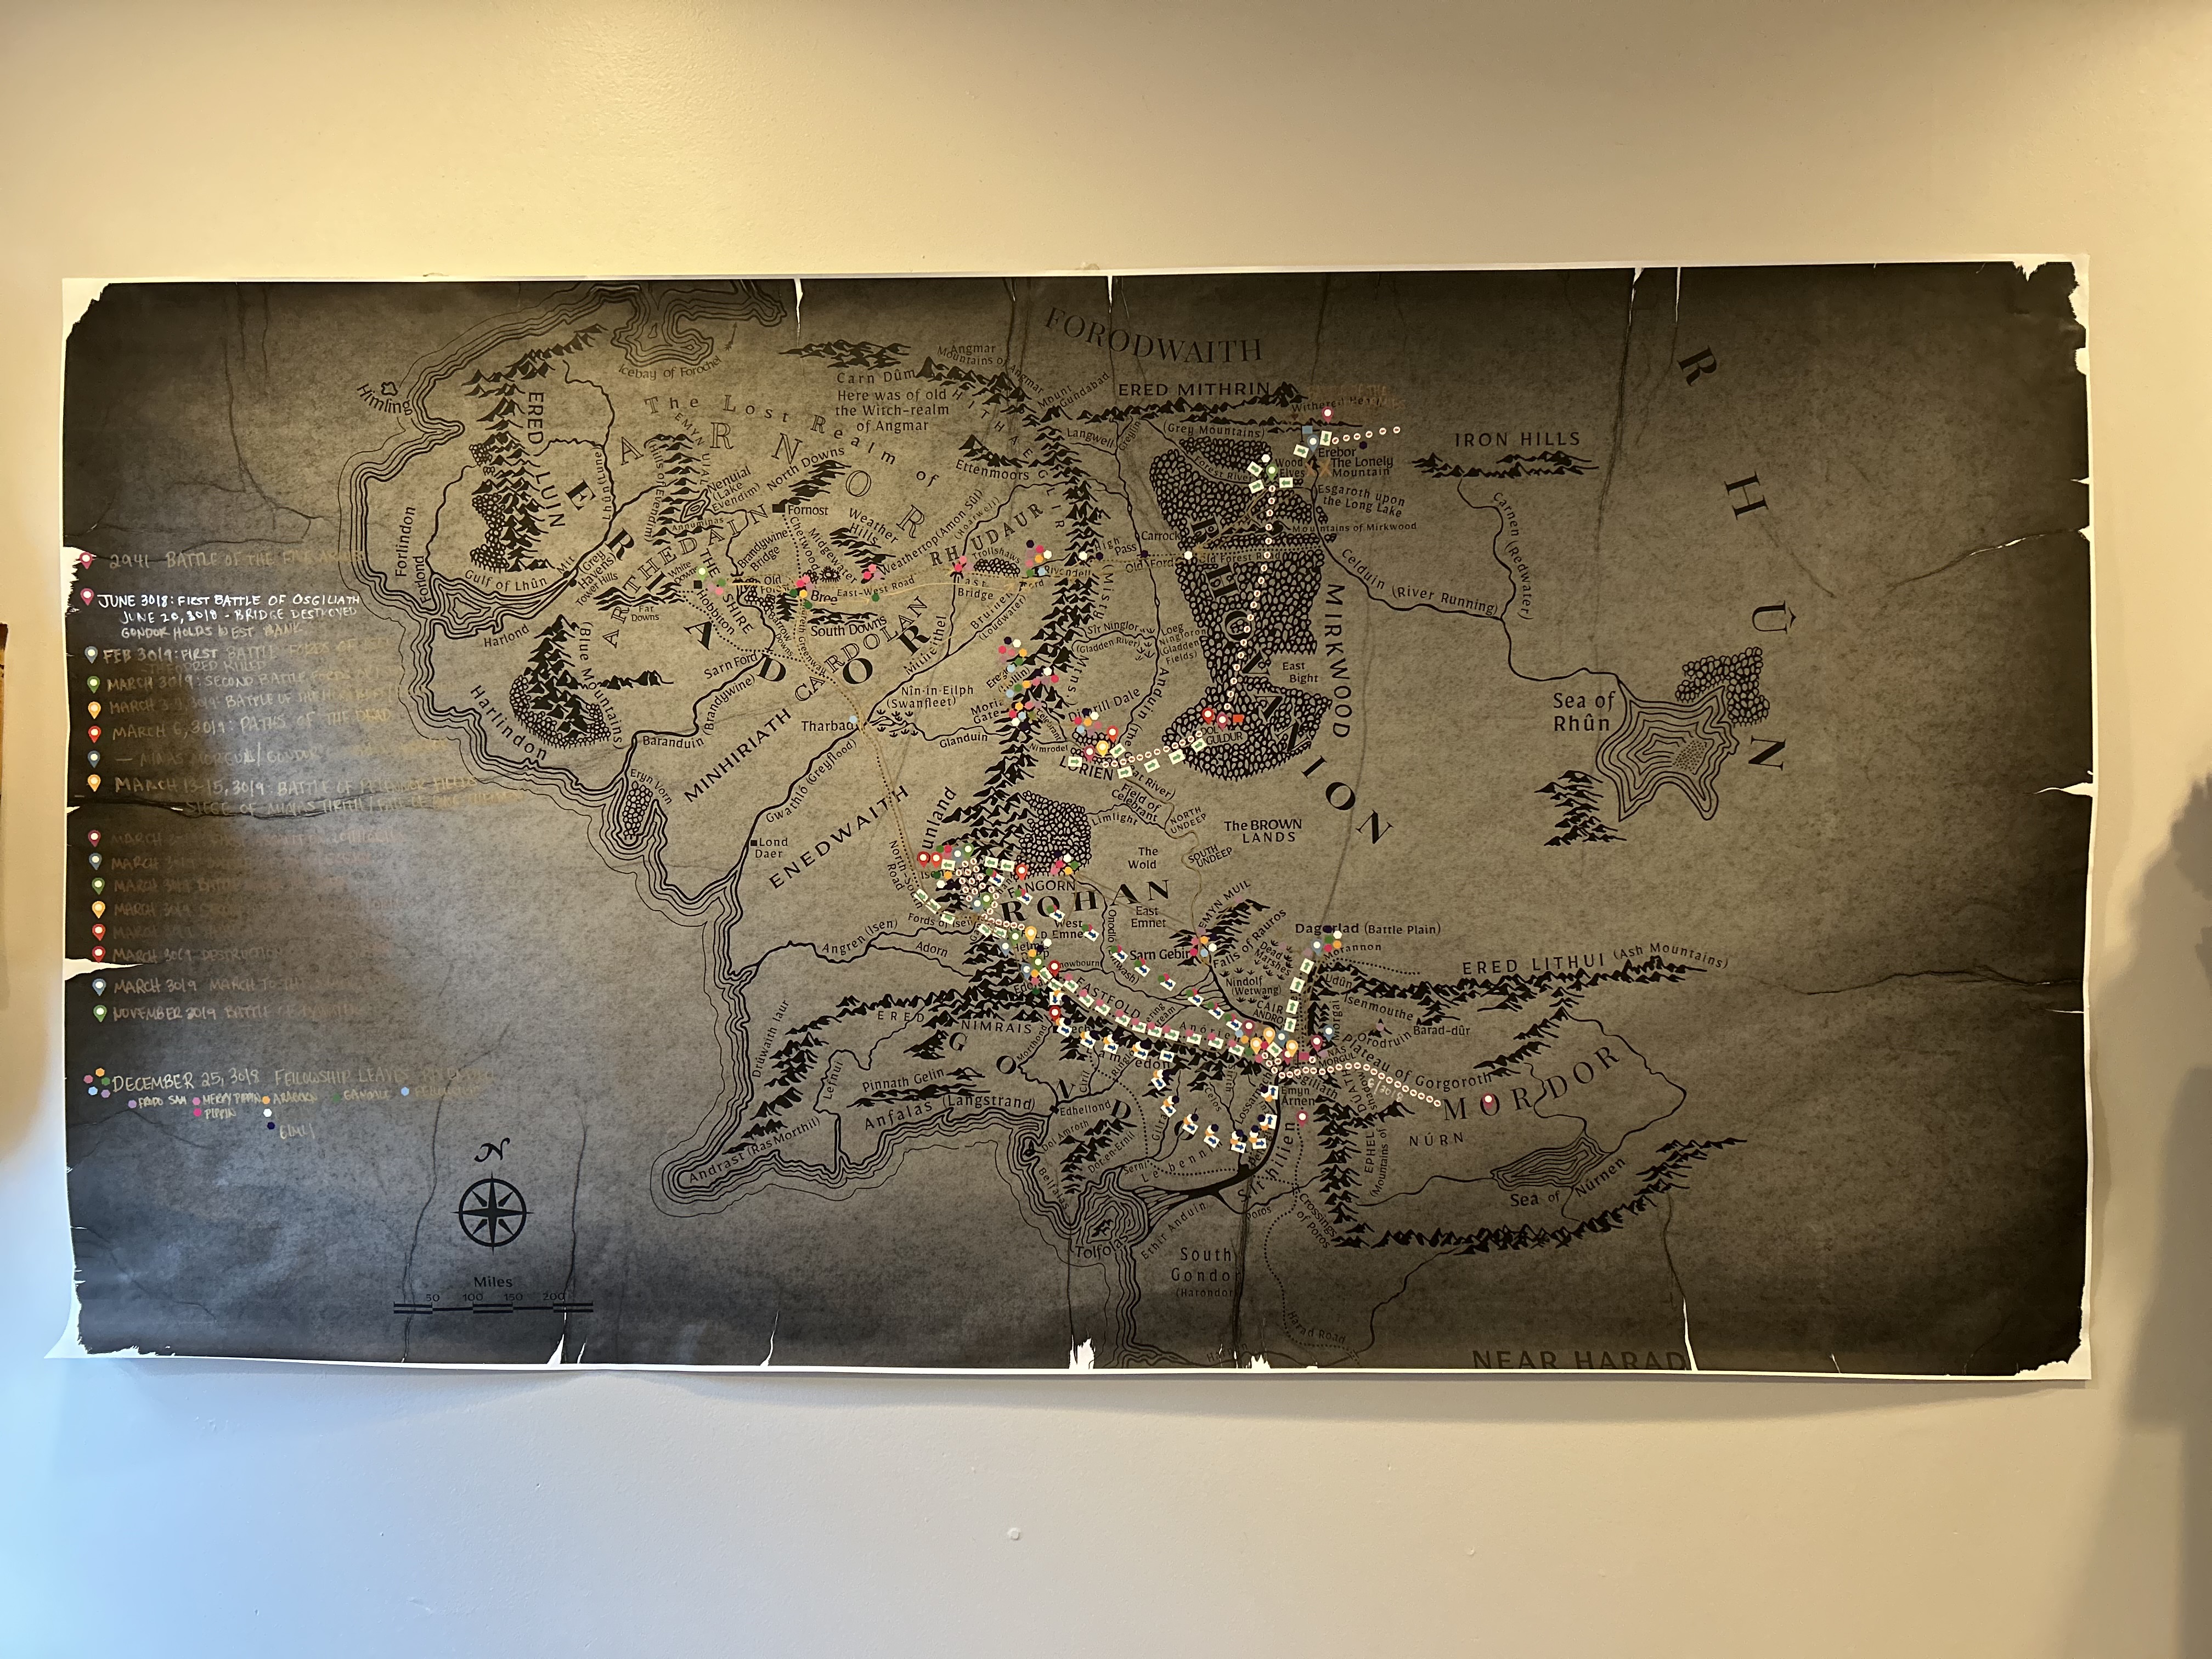
I printed a map of Middle-earth forty inches high and more than six feet wide, mounted it on my bedroom wall, and started tracking the movements of every major army and character through The Lord of the Rings.
I know the story. What I could not reliably hold in my head was the geography.
The battles happen across enormous distances, with different groups moving simultaneously toward objectives they do not always understand. Some journeys overlap. Others nearly do. Decisions made in one location create consequences somewhere else days or weeks later.
I wanted to see the whole system at once.
So I turned the map into a working model. I developed a visual language of colored arrows, labels, pins, symbols, and movement markers to separate campaigns, armies, key characters, retreats, and deaths. I can trace the battles at Osgiliath, the Fords of Isen, Helm’s Deep, Isengard, and the movement from Minas Morgul toward Minas Tirith without collapsing them into one vague sequence of “and then everybody went east.”
Once the movements are visible, the story changes. Geography becomes a constraint rather than background. Timing becomes meaningful. Relationships between events become easier to understand, and individual decisions take their proper place inside the larger system.
This is how I process complexity.
I externalize it. I identify the important entities and relationships. I create a consistent visual language. Then I keep mapping until the structure becomes visible enough to explain.
The artifact may be a six-foot map, a customer journey, a data architecture, or a lifecycle spanning brands, platforms, channels, and teams.
The behavior is the same: give me a complicated system, and I will find a way to see how it moves.


Discussing my analysis of the Osgiliath campaign with John Rhys-Davies at New York Comic Con, 2026.